Clinical Study Insights

A Randomized, Double-Blind, Placebo-Controlled Clinical Study to Evaluate the Modulatory Effect of Lutein and Zeaxanthin Supplementation on Macular Pigment Optical Density (MPOD), Glare Disability and Photo Stress in Healthy Subjects
120 healthy adults (45-65 years)
• 20 mg (per day)
At Day 0, 45, and 90 included MPOD measurement, glare disability tests, photo-stress recovery, and plasma lutein/zeaxanthin quantification.
Changes in MPOD, glare disability, photo-stress recovery time, and plasma lutein/zeaxanthin levels.
Safety assessment through biochemical and haematological analyses.
Macular Pigment Optical Density (MPOD)
MPOD represents the concentration of macular carotenoids lutein and zeaxanthin in the retina, serving as a biomarker for visual health and protection against blue-light-induced oxidative damage.
MPOD levels were assessed using Heterochromatic Flicker Photometry (HFP)
Macular Pigment Optical Density (MPOD)
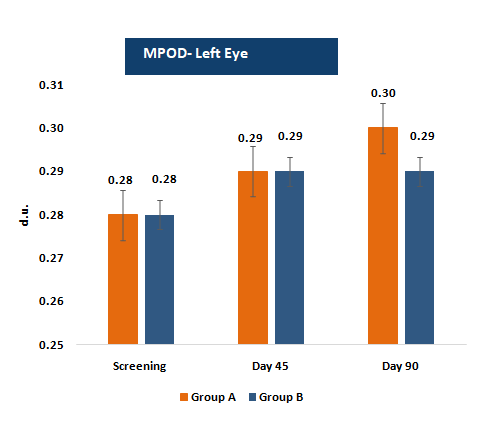

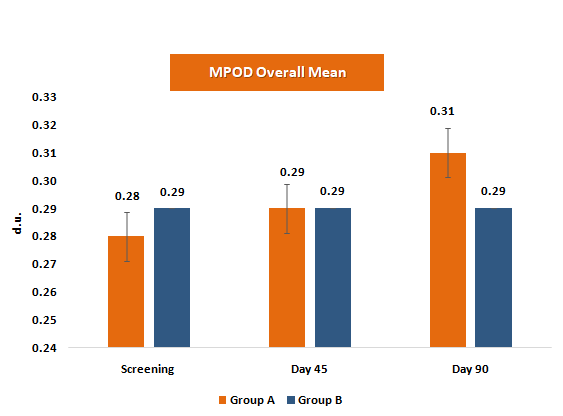
- • Baseline (Screening Day -3): Comparable between groups (Group A: 0.28 ± 0.03; Group B: 0.29 ± 0.03; p = 0.3291).
- • Day 45: Group A improved to 0.29 ± 0.03 (3.57% increase from baseline), while Group B showed no change 0.29 ± 0.03.
- • The between-group difference at Day 45 was not significant (p = 0.5849), but within-group improvement was significant only in Group A (p < 0.0001)
- • Day 90: By Day 90, Group A further improved to 0.31 ± 0.03 (+10.71% from baseline),while Group B stayed at 0.29 ± 0.03, giving a significant between-group difference (p = 0.0414).
- • Interpretation: MPOD significantly improved with supplementation in Group A versus placebo.
Glare disability assesses the reduction in visual performance or clarity when exposed to bright light. Improvement in glare disability reflects enhanced visual comfort and functional vision under high-luminance conditions, which are sensitive indicators of the protective effect of macular pigments.
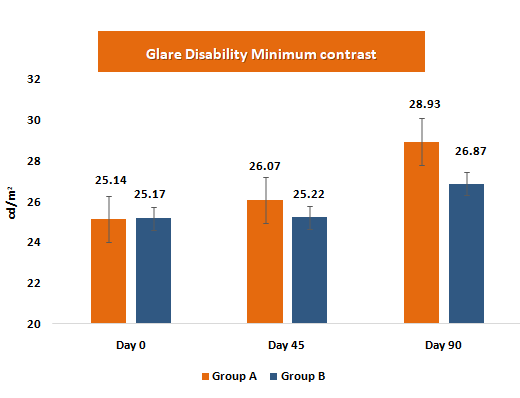
- • Baseline (Day 0): Comparable between groups (Group A: 25.14 ± 1.23; Group B: 25.17 ± 1.06; p = 0.8867).
- • Day 45: Group A improved to 26.07 ± 1.16 (3.70% increase from baseline), while Group B remained almost unchanged (25.20 ± 1.23; 0.11% increase). The between-group difference was significant (p = 0.0006), within-group improvement significant only in Group A (p < 0.0001).
- • Day 90: Group A further improved to 28.93 ± 0.97 (+15.07% from baseline), while Group B improved modestly to 26.87 ± 1.37 (+6.75%). The between-group difference was highly significant (p < 0.0001), with both groups showing significant within-group changes (p < 0.0001), but improvement was markedly greater in Group A.
- • Interpretation: Minimum-contrast glare disability improved consistently in group A indicating clear visual benefits of the supplementation.

- • Baseline (Day 0): Comparable between groups (Group A: 22.23 ± 1.36; Group B: 21.89 ± 1.16; p = 0.2035).
- • Day 45: Group A improved to 23.16 ± 1.26 (+4.18% from baseline), while Group B showed a minimal change to 22.09 ± 1.12 (+0.91%). Between-group difference was significant (p < 0.0001), within-group improvement significant only in Group A (p < 0.0001).
- • Day 90: Group A further improved to 25.95 ± 0.86 (+16.73%), compared with 23.02 ± 1.14 (+5.16%) in Group B, with a highly significant between-group difference (p < 0.0001).
- • Interpretation: Supplementation in Group A resulted in substantial improvements in glare disability at maximum contrast compared with Group B.
PSRT measures the duration required for vision to recover after exposure to a bright light source.
A shorter recovery time indicates improved retinal resilience and photoreceptor function, providing functional evidence of enhanced visual performance due to supplementation.
Photo-Stress Recovery Time (PSRT)
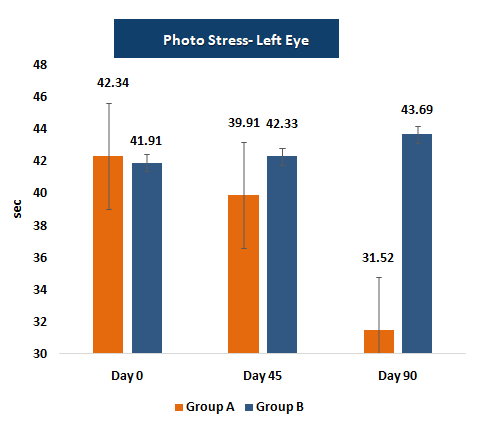
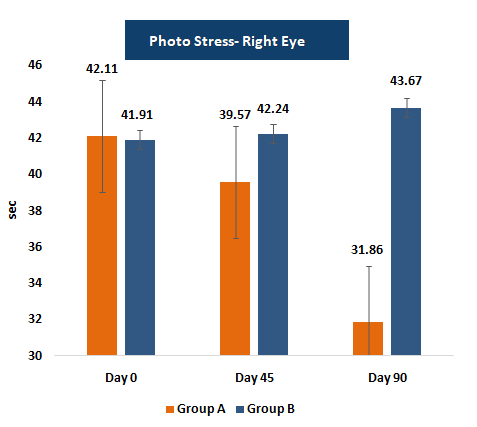

- • Baseline (Day 0): Similar between groups (Group A: 42.22 ± 4.43; Group B: 41.91 ± 4.66; p = 0.7166).
- • Day 45: Group A improved to 39.74 ± 4.04 (-5.87% from baseline), while Group B remained near baseline at 42.29 ± 3.93 (+0.90%). Between-group difference was significant (p = 0.0011); within-group improvement was significant only in Group A (p < 0.0001).
- • Day 90: Group A further improved to 32.19 ± 2.49 (-23.75%), while Group B stayed near baseline at 43.68 ± 4.25 (+4.22%), with a highly significant between-group difference (p < 0.0001).
- • Interpretation: Group A showed consistent and meaningful improvement in overall photo stress recovery compared with Group B.
Plasma concentrations of lutein and zeaxanthin serve as biochemical markers of systemic absorption and bioavailability. Increases in these levels correlate with enhanced macular deposition and visual benefits, supporting the biological plausibility of efficacy findings.
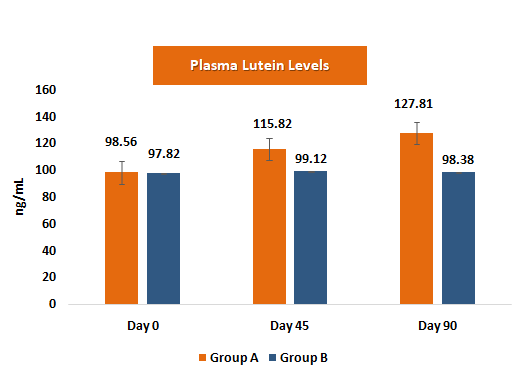
- • Baseline (Day 0): Plasma lutein levels were similar between groups (Group A: 98.56 ± 7.06 ng/mL; Group B: 97.82 ± 7.30 ng/mL; p = 0.7950).
- • Day 45: Group A increased to 115.82 ± 7.49 ng/mL (+17.51%), while Group B showed a minimal rise to 99.12 ± 7.24 ng/mL (+1.33%). The between-group difference was highly significant (p < 0.0001).
- • Day 90: Group A further increased to 127.81 ± 12.66 ng/mL (+29.68%), whereas Group B remained essentially unchanged at 98.38 ± 7.30 ng/mL (+0.57%), showing a strong between-group difference (p < 0.0001).
- • Interpretation: Plasma lutein levels increased consistently and significantly in Group A, with negligible changes in Group B.
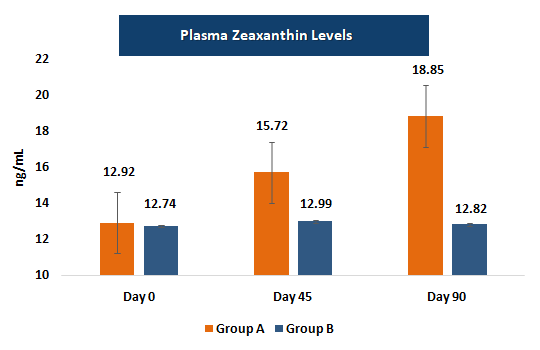
- • Baseline (Day 0): Zeaxanthin levels were similar between groups (Group A: 12.92 ± 2.43 ng/mL; Group B: 12.74 ± 2.92 ng/mL; p = 0.7491).
- • Day 45: Group A increased to 15.72 ± 2.90 ng/mL (+21.67%), while Group B changed to 12.99 ± 2.81 ng/mL (+1.96%) (p < 0.0001). Group A showed a statistically significant rise compared to Group B at Day 45.
- • Day 90: Group A reached 18.85 ± 3.16 ng/mL (+45.90%), and whereas Group B measured 12.82 ± 2.91 ng/mL (+0.63%) (p < 0.0001). The difference between the groups remained statistically significant at Day 90.
- • Interpretation: Group A demonstrated progressive increases from Day 0 to Day 90, whereas Group B showed minimal percentage change across visits.
Participant’s experience strongly aligned with the study outcomes. Adverse effects were minimal and comparable between groups (Group A: 3.6%, Group B: 3.7%, p = 0.8905), confirming excellent safety.
Perceived benefits were markedly higher in Lutenic® Group:
✓ No major adverse events occurred, and both study groups were comparable in vital signs, physical exams, and laboratory findings.
- • Hematology, RFT, LFT, Lipid profile, and Urine analysis remained within normal limits across all visits.
- • No clinically significant changes from baseline to Day 90.
- • Confirms no biochemical or organ-function concerns.
- • Temperature, pulse, respiration, and blood pressure were stable at all time points.
- • No abnormal or clinically relevant shifts observed.
- • Overall, the investigational product demonstrated excellent safety and tolerability.
- • Daily supplementation with 20 mg lutein–zeaxanthin for 90 days significantly improved visual function in healthy adults (Group A).
- • MPOD increased steadily at Day 45 and Day 90, with statistically significant within-group improvements and clinically meaningful percentage gains (~3.6% at Day 45 to ~10.7% at Day 90).
- • Glare tolerance improved by +3.79 (minimum contrast) and +3.71 (maximum contrast) units, compared with +1.70 and +1.13 units in the placebo group.
- • Photo-stress recovery time decreased to ~32.2 seconds in the supplemented group versus ~43.7 seconds in placebo.
- • Plasma levels increased substantially, with lutein rising by ~29.7% and zeaxanthin by ~45.9%; plasma levels in the placebo group remained essentially unchanged.
- ✓ The supplementation was well tolerated and effectively supported macular health and visual performance under light-induced stress.
Copyright © 2026 Lutenic® | All Rights Reserved.